Method Add |
FinAnalysis indicators are created in such way that the values for processing (prices, volumes etc.) should be passed through a special method Add().
As an example, we can use this method in the following manner:
1sma.Add(CurrentPrice);This method updates indicator’s value using the most recent observation of price.
Similarly, the following method updates the indicator’s value and allows you to utilize a time window or introduce time for a particular calculation:
1sma.Add(CurrentPrice, CurrentTime);Note that you must use only one realization of this method for each instance. An exception will be thrown otherwise.
There are several types of technical indicators. Indicators of the same type have the same prototype of method Add():
a) Simple:
b) Bar:
Add(Double, Double, Double, Double, Double)
Add(Double, Double, Double, Double, Double, DateTime)
c) Tick:
d) Two Series:
Here follows the table of indicators by the type method Add():
Type | Indicator |
Simple | AdfTest , Lsma, Autocorrelation, Maximum, Autocorrelogram, Minimum, Bollinger, Mma, Cma, Macd, Envelope, PriceOscillator, Ema, RSquared, Kama, Sma, KpssTest, Slope |
Bar | Ad, Sar, Aroon, Pfe, Adxr, VolumeIndex, Atr, Pvt, Cci, Rwi, DeMarker, Roc, ForceIndex, Rsi, Keltner, Stochastic, MassIndex, TrueRange, MesaSinewave, UltimateOscillator, Momentum, ValueArea, Mfi, Wr, Obv, Wad |
Tick | |
Two series |
An indicator returns either a single value or a set of values. Every indicator has a property Value that can be used to obtain all values of the indicator. In case of Sma this property returns one value, in case of some other indicators, for example Bollinger Bands, it returns a slice of several values. Also, every indicator has one or several named properties (like SMA in Sma or UpperBand in Bollinger).
To get the value of Sma indicator you can use:
1double IndicatorValue = sma.SMA;
Let’s consider an example that illustrates the difference between integer period and time period. Suppose we are working with tick data and we are interested in two separate methods of SMA: averaging by number of trades and averaging by time.
 1using FinAnalysis.TA;
 2using FinAnalysis.Base;
 3
 4// Create new instances of SMA
 5// with averaging by number of trades
 6Sma smaNum = new Sma(50);
 7// with time period = 5 seconds
 8Sma smaTime = new Sma(new TimeSpan(0, 0, 5));
 9
10public override void OnTick()
11{
12    //...
13
14    // Add tick for first SMA
15    smaNum.Add(CurrentPrice);
16    // Add tick for second SMA
17    smaTime.Add(CurrentPrice, CurrentTime);
18    // Get values
19    double SMATrades = smaNum.SMA;
20    double SMATime = smaTime.SMA;
21
22    //...
23}
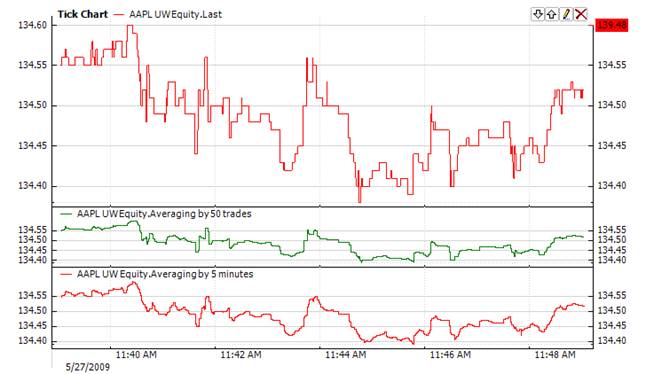
If we chart these values, we will see the following:

The first indicator calculates the average of 50 trades. Because trades are not periodical, data time interval for 50 trades is different every time. In contrast, the second indicator calculates the average for a certain time interval, regardless of the number of trades during the time span.