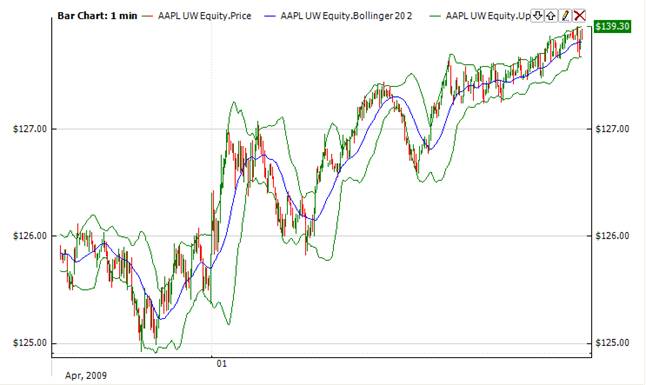
Bollinger Bands |
Bollinger consist of three lines. The middle band is a simple moving average (generally 20 periods) of the typical price. The upper and lower bands are n standard deviations (generally 2) above and below the middle band. The bands widen and narrow when the volatility of the price is higher or lower, respectively. %b tells you where you are in relation to the bands. %b equals 1 at the upper band and 0 at the lower band. BandWidth tells you how wide the Bollinger Bands are on a normalized basis.
Bollinger is an indicator of overbought or oversold conditions. When the price is near the upper or lower band it indicates that a reversal may be imminent. The middle band becomes a support or resistance level. The upper and lower bands can also be interpreted as price targets. When the price bounces off of the lower band and crosses the middle band, then the upper band becomes the price target.


To initialize Bollinger use one of the constructors:
Bollinger – set default values: period = 14, factor = 2.0 (F in the formula)
Bollinger(Int32, Double) – set values for period and factor
Bollinger(TimeSpan, Double) – set time period and factor
Use
properties to get current value.
 1// Create new instance
 2Bollinger bbands = new Bollinger(28, 3.0);
 3
 4// Number of stored values
 5bbands.HistoryCapacity = 2;
 6
 7// Add new data point
 8bbands.Add(CurrentPrice, CurrentTime);
 9
10// Get indicator values
11double IndMiddleBand = bbands.MiddleBand;
12double IndLowerBand = bbands.LowerBand;
13double IndUpperBand = bbands.UpperBand;
14// Get previous values
15if (bbands.HistoryCount == 2)
16{
17    double IndPrevMiddleBand = bbands[1].MiddleBand;
18    double IndPrevLowerBand = bbands[1].LowerBand;
19    double IndPrevUpperBand = bbands[1].UpperBand;
20}