On Balance Volume |
Obv technical indicator is a momentum technical indicator that relates volume to price change. When the security closes higher than the previous close, all of the day’s volume is considered up-volume. When the security closes lower than the previous close, all of the day’s volume is considered down-volume.
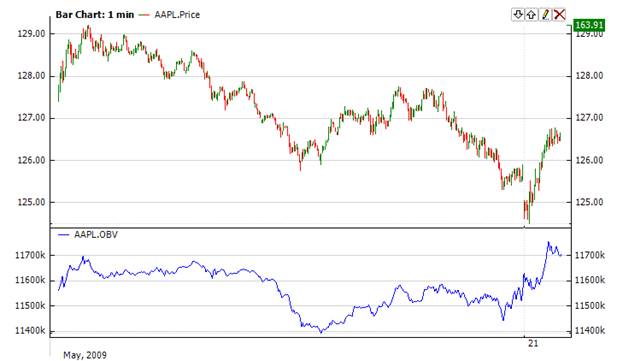
To interpret the Obv, look for the Obv to move with the price or precede price moves. If the price moves before the Obv, then it is a non-confirmed move. A series of rising peaks, or falling troughs, in the Obv indicates a strong trend. If the Obv is flat, then the market is not trending.
When the Obv changes to a rising or falling trend, a "breakout" has occurred. Since Obv breakouts normally precede price breakouts, investors should go long on Obv upside breakouts. Likewise, investors should sell short when the Obv makes a downside breakout. Positions should be held until the trend changes.


Indicator has no input parameters. To initialize Obv indicator use the following constructor:
Use
OBV - property to get current value.
 1// Create new instance
 2Obv obv = new Obv();
 3
 4// Number of stored values
 5obv.HistoryCapacity = 2;
 6
 7// Add new data point
 8obv.Add(Bars.Current.Open, Bars.Current.High, Bars.Current.Low, Bars.Current.Close, Bars.Current.Volume);
 9
10// Get indicator value
11double IndicatorValue = obv.OBV;
12// Get previous value
13if (obv.HistoryCount == 2)
14{
15    double IndicatorPrevValue = obv[1];
16}