Slope Of Linear Regression |
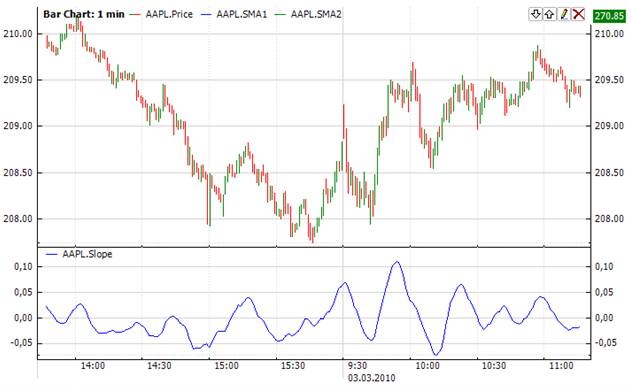
The slope of linear regression (Slope) is used for prediction of the following market values based on the previous ones. It is considered as a statistical engine. The linear regression is usually drawn as a straight line. Still the linear regression indicator does not correspond to a straight line following the price fluctuations while being traced. Each end point of an imaginary linear regression trend line makes up a path for this curve. All these imaginary trend lines are placed at nearest distance (length) to the closing prices through 'least squares' method applied to the input set bars.
It helps to find out the possible values of the market prices in the predicted future according to recent and present data. If a price trend rises or descends, the linear regression suggests the possible angle of an uptrend/downtrend basing on the current price. It is thought that if the price differs from the linear regression line, it gets too strained and starts motion in direction to the line. Thereby this indicator allows user to understand the moment of price trend change.

where rxy is the sample correlation coefficient between x and y, sx is the standard deviation of x, and sy is correspondingly the standard deviation of y.
To initialize Slope indicator use one of the following constructors:
Slope(Int32, Boolean) – creates new instance of Slope indicator with point window
Use
LineSlope - property to get current value.
 1// Create new instance
 2Slope slope = new Slope(30, false);
 3
 4// Number of stored values
 5slope.HistoryCapacity = 2;
 6
 7// Add new data point
 8slope.Add(CurrentPrice);
 9
10// Get indicator value
11double IndicatorValue = slope.LineSlope;
12
13// Get previous value
14if (slope.HistoryCount == 2)
15{
16    double IndicatorPrevValue = slope[1];
17}