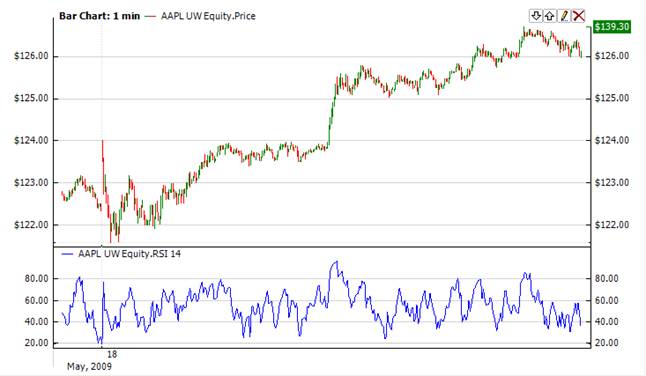
Relative Strength Index |
The Relative Strength Index (Rsi) calculates the ratio of the recent upward price movements to the absolute price movement. The Rsi ranges from 0 to 100. The Rsi is interpreted as an overbought/oversold indicator when the value is over 70/below 30. You can also look for divergence with price. If the price is making new highs/lows, and the Rsi is not, it indicates a reversal.
A popular method of analyzing the Rsi is to look for a divergence in which the security is making a new high, but the Rsi is failing to surpass its previous high. This divergence foreshadows an impending reversal. When the Relative Strength Index then turns down and falls below its most recent trough, it is said to have completed a "failure swing". The failure swing is considered a confirmation of the expected reversal.


To initialize Rsi use one of the following constructors:
Rsi – sets default values: period = 14
Rsi(Int32, Boolean) – sets value for period
Rsi(IAverager, IAverager, Boolean) – sets the type of averaging for UpAvg and DownAvg (see formula)
Use
RSI - property to get current value
 1// Create new instance
 2Rsi rsi = new Rsi(28);
 3
 4// Number of stored values
 5rsi.HistoryCapacity = 2;
 6
 7// Add new data point
 8rsi.Add(Bars.Current.Open, Bars.Current.High, Bars.Current.Low, Bars.Current.Close, Bars.Current.Volume);
 9
10// Get indicator value
11double IndicatorValue = rsi.RSI;
12// Get previous value
13if (rsi.HistoryCount == 2)
14{
15    double IndicatorPrevValue = rsi[1];
16}