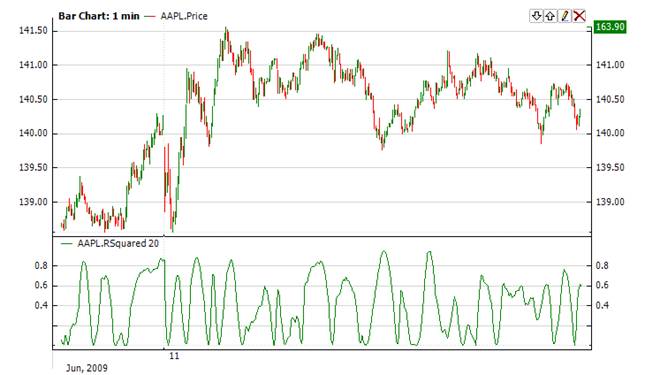
RSquared |
The Linear Regression Trend Line approximates projected path of the data. The correlation between the outcome and the values being used for prediction can be described by the R-Squared or R2 indicator (RSquared). A perfect fit is observed when R-Squared is 1.0 and no fit is observed when RSquared is 0. RSquared of 0 implies that that there is no relationship between the price and the Linear Regression Trend Line.
When RSquared hovers around high levels (say close to 1.0), a short position should be considered, countering the prevailing trend. For example, a short position can be opened when the price is in a rising trend and the R-squared exceeds the 0.80 point level.

Where x is a price, t is a time of this price, n is a period of indicator

To initialize RSquared indicator use one of the following constructors:
RSquared – sets default values: period = 14, useTime = false
RSquared(Int32, Boolean) – sets period and useTime flag. If this flag is true, to calculate the indicator values, time (in 100 nanoseconds) will be used and you need to use method Add() with time. If this flag is false, a number of data points will be used for calculation. In this case you can use method Add() without time.
RSquared(TimeSpan, Boolean) – sets time period and useTime
Use
RSquaredValue - property to get current value
 1// Create new instance
 2RSquared rsq = new RSquared(28, false);
 3
 4// Number of stored values
 5rsq.HistoryCapacity = 2;
 6
 7// Add new data point
 8rsq.Add(CurrentPrice);
 9
10// Get indicator value
11double IndicatorValue = rsq.RSquaredValue;
12// Get previous value
13if (rsq.HistoryCount == 2)
14{
15    double IndicatorPrevValue = rsq[1];
16}