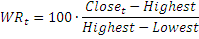
WR |
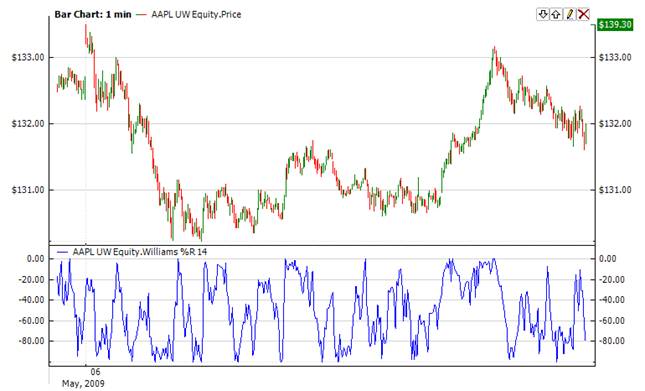
Williams’ %R(Wr) is a dynamic technical indicator, which determines whether the market is overbought or oversold. Williams’ %R is very similar to the Stochastic Oscillator. The only difference is that %R has an upside down scale and the Stochastic Oscillator has internal smoothing. To show the indicator in this upside down fashion, place a minus symbol before the Williams Percent Range values (for example -30%). One should ignore the minus symbol when conducting the analysis.
Indicator values ranging between 80 and 100% indicate that the market is oversold. Indicator values ranging between 0 and 20% indicate that the market is overbought.
Where:


To initialize Wr indicator use one of the following constructors:
Wr – sets default values: period = 14
Wr(Int32) – sets period for indicator
Wr(TimeSpan) – sets time period for indicator
Use
WR - property to get current value
 1// Create new instance
 2Wr wr = new Wr(28);
 3
 4// Number of stored values
 5wr.HistoryCapacity = 2;
 6
 7// Add new data point
 8wr.Add(Bars.Current.Open, Bars.Current.High, Bars.Current.Low, Bars.Current.Close, Bars.Current.Volume, CurrentTime);
 9
10// Get indicator value
11double IndicatorValue = wr.WR;
12// Get previous value
13if (wr.HistoryCount == 2)
14
15{
16    double IndicatorPrevValue = wr[1];
17}