Accumulation |
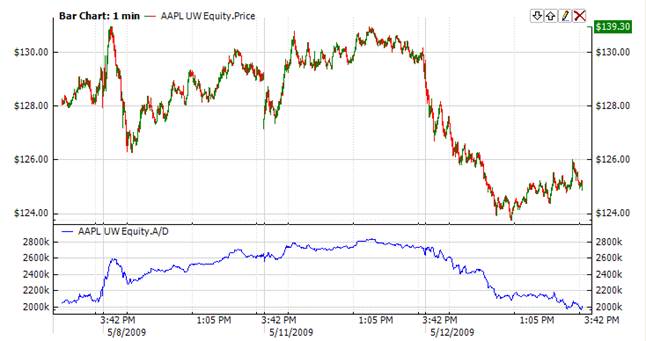
The Ad indicator seeks to distinguish between all upward movements (accumulation) in the period, when the price has increased by the closing point, and downward movements (distribution) in the period, when the price has decreased by the closing point. The Ad indicator helps determine if the market is controlled by buyers (accumulation) or by sellers (distribution). This indicator gives seldom signals forming discrepancy with the price at the critical tendencies' breaks.
Difference between the highest price (high) and the close price (close) is subtracted from the difference between the close price (close) and the lowest price (low). The resulting value is multiplied by volume and divided by the difference of the highest and lowest prices. The indicator is equal to the sum of expression for all intervals.
The idea behind this technical indicator is that divergence between the Ad indicator and the price of the security should foretell upcoming price movements. In case of such divergences, the price tendency moves in the direction in which the indicator moves. Thus, if the indicator is increasing, but the price of the security is dropping, a price turnaround should be expected.


Accumulation/Distribution indicator has no input parameters. To initialize Ad indicator, use the following constructor:
Use AD property to get current A/D value
 1// Initialize
 2Ad ad = new Ad();
 3
 4// Number of stored values
 5ad.HistoryCapacity = 2;
 6
 7// Add new values to indicator
 8ad.Add(Bars.Current.Open, Bars.Current.High, Bars.Current.Low, Bars.Current.Close, Bars.Current.Volume, CurrentTime);
 9
10// Get indicator value
11double IndicatorValue = ad.AD;
12
13// Get previous value
14if (ad.HistoryCount == 2)
15{
16    double IndicatorPrevValue = ad[1];
17}