Aroon |
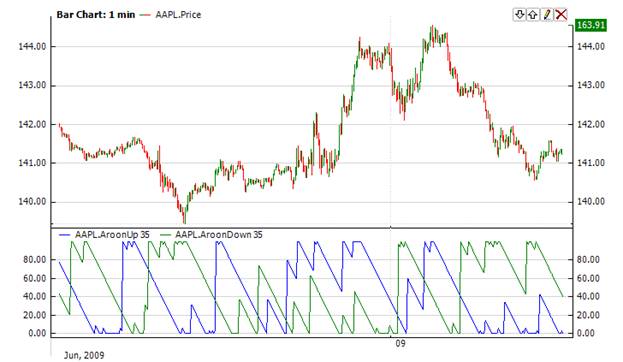
The Aroon indicator attempts to predict when a new trend is forming. The indicator consists of two lines (Up and Down) that measure how long it has been since the highest high/lowest low has occurred within an n period range.
When Aroon Up hovers between 70 and 100, it indicates an upward trend. When Aroon Down is between 70 and 100, it indicates a downward trend. A strong upward trend is indicated when the Aroon Up is above 70 while the Aroon Down is below 30. Likewise, a strong downward trend is indicated when the Aroon Down is above 70 while the Aroon Up is below 30. Also look for crossovers. When the Aroon Down crosses above the Aroon Up, it indicates a weakening of the upward trend and vice versa.

To initialize Aroon indicator use one of the constructors provided:
Aroon – this constructor sets default value(14) for period.
Aroon(Int32) - sets point period of the indicator
Aroon(TimeSpan) – sets up time period for this indicator
Use
properties to get current values.
 1// Create new instance
 2Aroon aroon = new Aroon(14);
 3
 4// Number of stored values
 5aroon.HistoryCapacity = 2;
 6
 7// Add new data point
 8aroon.Add(Bars.Current.Open, Bars.Current.High, Bars.Current.Low, Bars.Current.Close, Bars.Current.Volume, CurrentTime);
 9
10// Get indicator values
11double IndAroonUp = aroon.AroonUp;
12double IndAroonDown = aroon.AroonDown;
13
14// Get previous value
15if (aroon.HistoryCount == 2)
16{
17    double IndicatorPrevValue = aroon[1];
18}