Money Flow Index |
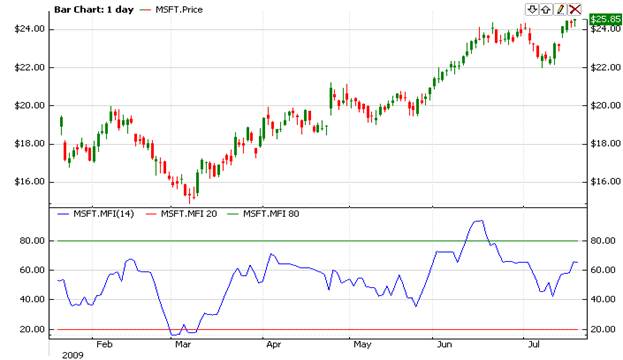
The Money Flow Index (Mfi) indicator is volume-weighted momentum indicator developed to measure the strength of money flowing in and out of a security over a specified time period and to determine if there is too much or too little volume associated with the security (overbought and oversold conditions). It is similar to Relative Strength Index (Rsi) in interpretation but volume weighting makes this indicator more rigid. The indicator calculates the rate (intensity) on a 0 - 100 scale at which money is invested into a security by comparing "positive money flow" (invested) to "negative money flow" (withdrawn).
A security is considered Overbought (indicates market top) if the Mfi indicator reaches 80 and more. Similarly, a security is Oversold (market bottom) if the Mfi is 20 or less.


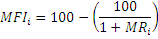
where N is a period for calculating indicator.
To initialize Mfi use one of the following constructors:
Mfi – sets default values: period = 14
Mfi(Int32) – sets period
Mfi(TimeSpan) – sets time period
Use
MFI - property to get current value.
 1// Create new instance
 2Mfi mfi = new Mfi(28);
 3
 4// Number of stored values
 5mfi.HistoryCapacity = 2;
 6
 7// Add new data point
 8mfi.Add(Bars.Current.Open, Bars.Current.High, Bars.Current.Low, Bars.Current.Close, Bars.Current.Volume);
 9
10// Get indicator value
11double IndicatorValue = mfi.MFI;
12
13// Get previous value
14if (mfi.HistoryCount == 2)
15{
16    double IndicatorPrevValue = mfi[1];
17}