Parabolic SAR |
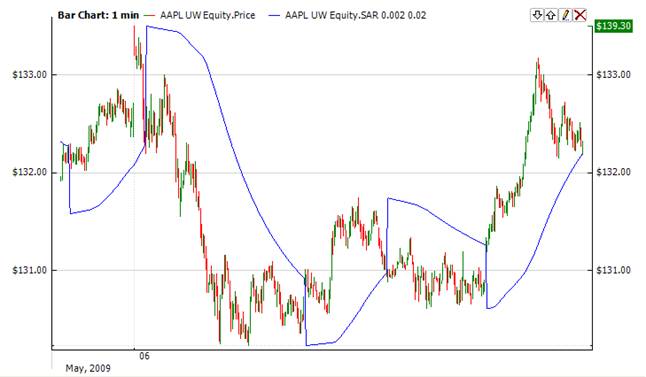
Parabolic SAR (Sar) technical indicator was developed for analyzing trending markets. The indicator is constructed on a price chart. It is similar to the Moving Average with the only difference being that Sar moves with higher acceleration and may change its position in terms of price. The indicator is below the security price on a bull market. In a bear market, it is above the security price.
When Sar crosses price from above it is a signal for a long position; and if it crosses security price from below, it is a signal for a short position. The Sar is an outstanding indicator for providing exit points. Long positions should be closed when the price sinks below the Sar line, short positions should be closed when the price rises above the Sar line. It is often the case that the indicator serves as a trailing stop line.
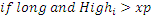

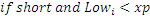

where xp is extreme point af is acceleration factor, it can’t be more than afMax

To initialize Sar use one of the following constructors:
Sar – sets default values: afStep = 0.02, afMax = 0.2
Sar(Double, Double) – sets values for indicator
Use
SAR - property to get current value
 1// Create new instance
 2Sar sar = new Sar(0.01, 0.1);
 3
 4// Number of stored values
 5sar.HistoryCapacity = 2;
 6
 7// Add new data point
 8sar.Add(Bars.Current.Open, Bars.Current.High, Bars.Current.Low, Bars.Current.Close, Bars.Current.Volume);
 9
10// Get indicator value
11double IndicatorValue = sar.SAR;
12// Get previous value
13if (sar.HistoryCount == 2)
14{
15    double IndicatorPrevValue = sar[1];
16}