Positive Negative Volume Index |
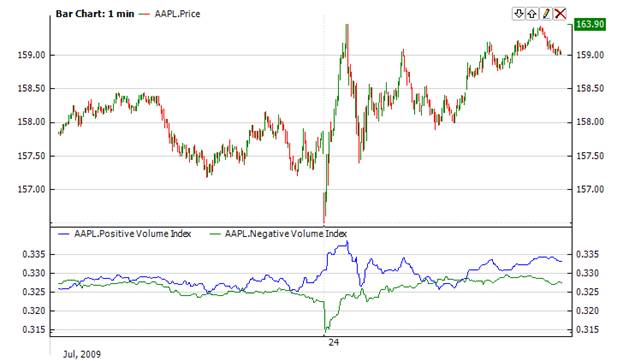
The Positive/Negative Volume Index (VolumeIndex) attempts to identify bull markets. The Positive Volume Index (PVI) shows what the uninformed investors are doing, while the Negative Volume Index (NVI) shows what the smart investors are doing. It is based on the assumption smart investors dominate trading on light volume days and uninformed investors dominates trading on active days. The PVI changes on days when the volume is up and stays flat on down volume days.
If NVI line above PVI it means a new trend is emerging. If, after that, PVI line crosses NVI line and stays above it, a long position can be opened.
Positive


Negative


Indicator has no input parameters. To initialize VolumeIndex use one of the following constructors:
Use
properties to get current value
 1// Create new instance
 2VolumeIndex volIndex = new VolumeIndex();
 3
 4// Number of stored values
 5volIndex.HistoryCapacity = 2;
 6
 7// Add new data point
 8volIndex.Add(Bars.Current.Open, Bars.Current.High, Bars.Current.Low, Bars.Current.Close, Bars.Current.Volume);
 9
10// Get indicator value
11double IndPotitiveIndex = volIndex.PVI;
12double IndNegativeIndex = volIndex.NVI;
13// Get previous values
14if (volIndex.HistoryCount == 2)
15{
16    double IndPrevPotitiveIndex = volIndex[1].PVI;
17    double IndPrevNegativeIndex = volIndex[1].NVI;
18}