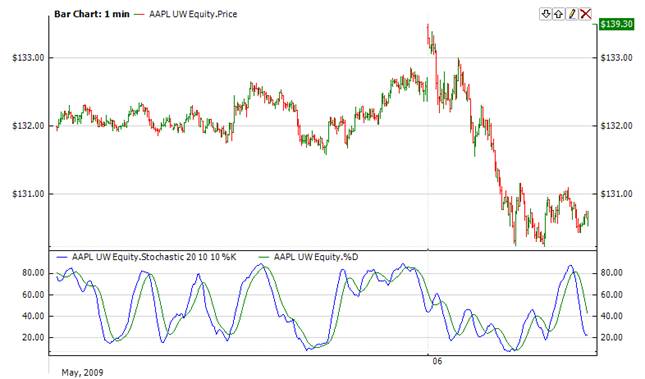
Stochastic Oscillator |
The Stochastic compares where a security’s price closed relative to its price range over a given time period. The Stochastic is displayed as two lines. The main line is called %K. The second line, called %D, is a Moving Average of %K. The %K line is usually displayed as a solid line and the %D line is usually displayed as a dotted line.
Buy when the Oscillator (either %K or %D) falls below a specific level (e.g., 20) and then rises above that level. Sell when the Oscillator rises above a specific level (e.g., 80) and then falls below that level.


To initialize Stochastic indicator use one of the following constructors:
Stochastic – sets default values: rawPeriod = 14, kPeriod = 3, dPeriod = 3
Stochastic(Int32, Int32, Int32) – sets values for periods
Stochastic(Int32, IAverager, IAverager) – sets raw periods and the type of averaging
Use
properties to get current value
 1// Create new instance
 2Stochastic stochastic = new Stochastic(28, 9, 6);
 3
 4// Number of stored values
 5stochastic.HistoryCapacity = 2;
 6
 7// Add new data point
 8stochastic.Add(Bars.Current.Open, Bars.Current.High, Bars.Current.Low, Bars.Current.Close, Bars.Current.Volume);
 9
10// Get indicator value
11double IndicatorValue = stochastic.PercentK;
12double IndicatorValue = stochastic.PercentD;
13// Get previous value
14if (stochastic.HistoryCount == 2)
15{
16    double IndicatorPrevValue = stochastic[1].PercentK;
17    double IndicatorPrevValue = stochastic[1].PercentD;
18}
Stochastic with custom averaging
 1// Create new instance
 2// Sets raw period = 28
 3// and EMA instead SMA
 4Stochastic stochastic = new Stochastic(28, new Ema(9), new Ema(6));
 5
 6// Add new data point
 7stochastic.Add(Bars.Current.Open, Bars.Current.High, Bars.Current.Low, Bars.Current.Close, Bars.Current.Volume);
 8
 9// Get indicator value
10double IndicatorValue = stochastic.PercentK;
11double IndicatorValue = stochastic.PercentD;