Value Area |
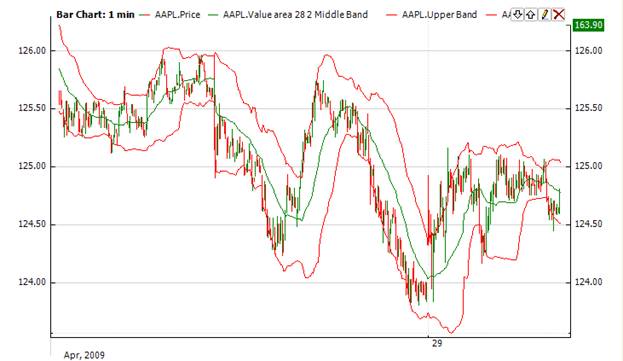
The ValueArea Indicator provides an automated band representing the volume-weighted value area. The ValueArea bands represent the prices between which a certain percent of the volume was traded.
Value area technical indicator is a mean reversion indicator interpreted similar to the Bollinger. In other words, short as the price is above the upper band and buy as it is below the lower band.
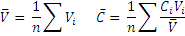
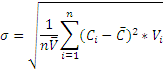

Where V – volume, C – close price, X – multiplier factor, n – period.
To initialize ValueArea indicator use one of the constructors provided:
ValueArea – sets default values: period = 14, factor = 1
ValueArea(Int32, Double) – sets values for period and factor
Use
properties to get current value
C#
 1// Create new instance
 2ValueArea va = new ValueArea(28, 2);
 3
 4// Number of stored values
 5va.HistoryCapacity = 2;
 6
 7// Add new data point
 8va.Add(Bars.Current.Open, Bars.Current.High, Bars.Current.Low, Bars.Current.Close, Bars.Current.Volume);
 9
10// Get indicator value
11double IndMiddleBand = va.MiddleBand;
12double IndUpperBand = va.UpperBand;
13double IndLoweBand = va.LowerBand;
14// Get previous values
15if (va.HistoryCount == 2)
16{
17    double IndPrevMiddleBand = va[1].MiddleBand;
18    double IndPrevUpperBand = va[1].UpperBand;
19    double IndPrevLoweBand = va[1].LowerBand;
20}